![]()
Tutorial 1 : Create a sound.
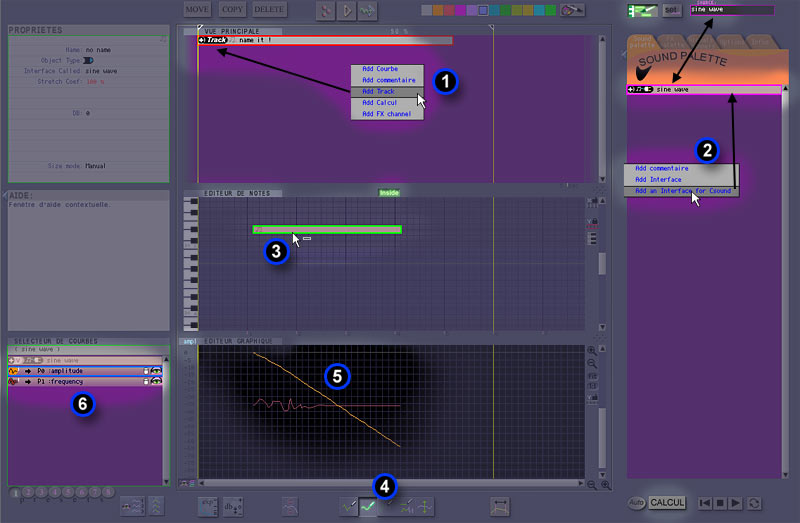
(1)
Click on the « main view » with the right button.
In the menu, select " add Track ".
You'll notice that the created object is framed
in red, it means that its content is shown in the "notes editor"
(nothing in this particular case because it's empty)
(2)
Click right button in the sheet "Sound Palette", then choose
in the menu "Add an interface for cSound",
A new menu appear with various cSound instruments. Select "Sine_Wave".
The created object is automatically framed pink,
it means that it serves as source for the « stamp tool ».
This tool allows you to create new object in the « notes editor
» by using a source object. The source
is defined either manually with the button [set], or by double-clicking
an interface.
Now, activate the stamp : ![]()
(3)
Click in the « notes editor ».
You've just created your first note, it is framed
green, it means that its content appears in the "curves selector"
and the "notes editor".
Deactivate [the stamp tool] by clicking on it or by pressing [ ESC]
Click on the button [Calcul] below to the right, if the file path access
to the cSound program is well definedl, you'll have the chance to hear
your first sound !
This very basic module generates a sinusoidal wave from an amplitude curve
and a frequency curve.
Now we're going to fluctuate the sound by modifying its parameters.
The drawings tools located in (4) allow different operations
on curves. By default the button "continuous line" is activated,
please, leave it as is.
![]()
(5)
Draw in the graphic editor a diagonal line from the top to the bottom
curve as on the screen capture.
Press the key [return] to calculate the sound.
Remark: if you wish to listen again last calculated sound, don't use the
button [calculation] but simply the button [play] or [space bar] key.
(6)
Click once on the curve "frequency" to activate it
in the "curves selector", it must be now framed
blue.
Draw small waves in the « graphic editor ». Press [return].
Notice the result.
Editable curves in the « graphic editor » are:
- The curves from the " curve selector " with same data format
as « graphic editor » (freq, ampl, user).
- Or the active curve framed in blue in any window.
Editable curves in the « graphic editor » are :
- Either the active curve framed blue
in any window.
- Or those from the " curve selector " with same data format
as « graphic editor » (freq, ampl, user).
Important: the active curve is exclusive and inhibits
editing for all the others, consequently to work on several curve simultaneously
it's advisable to deactivate it either by clicking it again, or by double-clicking
on a free zone of the « curves selector »
The options ( ) and [] excludes curves respectively from the watching
and from the editing.
In the File menu, save your project.
Now, test various manipulations on curves.
Use the other drawing tools, contextual help will guide you.